- HubSpot Community
- Resources
- Releases and Updates
- [Now Live] View Two Metrics at the Same Time with the 'Combination' Report Visualization in Sources and Pages
Releases and Updates
- Subscribe to RSS Feed
- Mark as New
- Mark as Read
- Bookmark
- Subscribe
- Printer Friendly Page
- Report Inappropriate Content
- Subscribe to RSS Feed
- Mark as New
- Mark as Read
- Bookmark
- Subscribe
- Printer Friendly Page
- Report Inappropriate Content
[Now Live] View Two Metrics at the Same Time with the 'Combination' Report Visualization in Sources and Pages
What is it?
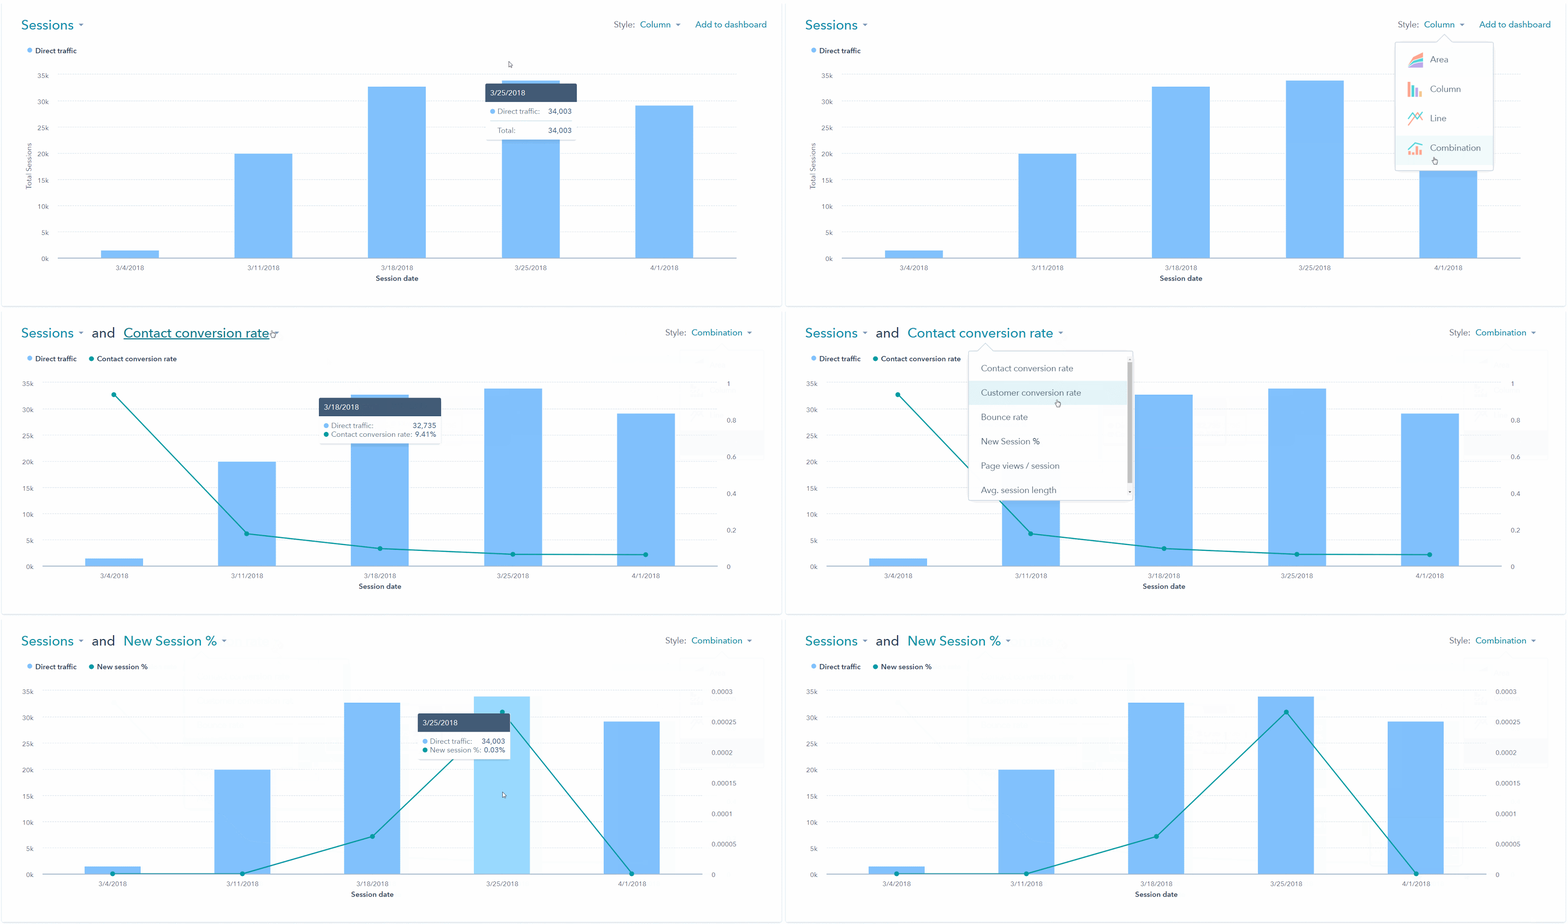
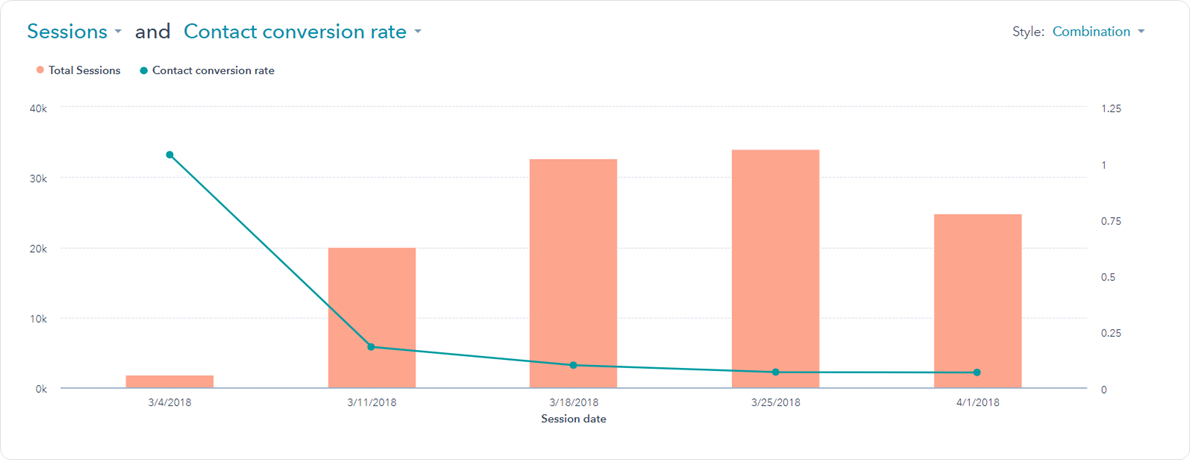
You can now view multiple metrics (including conversion rates!) at the same time in the sources and pages reports.

Why does it matter?
The new sources and pages reports in traffic analytics gives you a more accurate picture of how your site visitors are interacting with your content, and lets you quickly drill into your data, generate reports, and add those reports to dashboards to share with your team. In the old sources report, you could overlay your conversion rate on top of your traffic data to see how your website traffic was contributing to your lead generation over time. With today’s update, we’re not only adding that same functionality back to sources - we’re expanding on it. Metric combination is now more powerful in two ways:
- Providing new metrics for comparison in addition to conversion rate. Want to compare your site’s average session length or bounce rate to how many sessions your site’s generating? Now you can.
- For the first time, you can compare metrics within the page performance report. For example, you can now compare page views to bounce rate to determine how strong your site engagement is.
How does it work?
On the sources or pages report, select which metric you would like to analyze. Once you’ve selected your first metric, select the ‘Combination’ option under the ‘Style’ dropdown on the right hand side of the widget. You’ll now be able to compare metrics against each other in the same report, such as bounce rate and contact conversion rate.

Who gets it?
This is now live for all Marketing Hub Basic, Professional, and Enterprise accounts.
What language is it in?
All languages supported by HubSpot
- Updated in the App Marketplace: Essential Apps for Marketers
- New in the App Marketplace: Essential Apps for Customer Service
- reCAPTCHA opt-out for Commerce Hub Checkout
- [Live] Try invoices without enrolling in Commerce Hub
- [Live] Collect payments locally through PADs (Canada) in Commerce Hub
- [Live] Collect payments through BACs (UK) on Commerce Hub
- March 2024 Release Notes
- [Live] Accept Partial Payments on Invoices
- [Live] Display Multiple Tax IDs on Invoices
- [Live] Commerce Hub Subscription Timeline Card
You must be a registered user to add a comment. If you've already registered, sign in. Otherwise, register and sign in.