- HubSpot Community
- Resources
- Releases and Updates
- A New Design for Your Marketing Dashboard
Releases and Updates
- Subscribe to RSS Feed
- Mark as New
- Mark as Read
- Bookmark
- Subscribe
- Printer Friendly Page
- Report Inappropriate Content
- Subscribe to RSS Feed
- Mark as New
- Mark as Read
- Bookmark
- Subscribe
- Printer Friendly Page
- Report Inappropriate Content
A New Design for Your Marketing Dashboard
For many HubSpot customers, the Dashboard is the first stop in your day. We refer to it lovingly as the "morning cup of coffee" report, where you find the quick-hit scoop on your most important metrics --- leads, contacts, customers, asset performance, personas, and more --- before diving into the day's tasks.
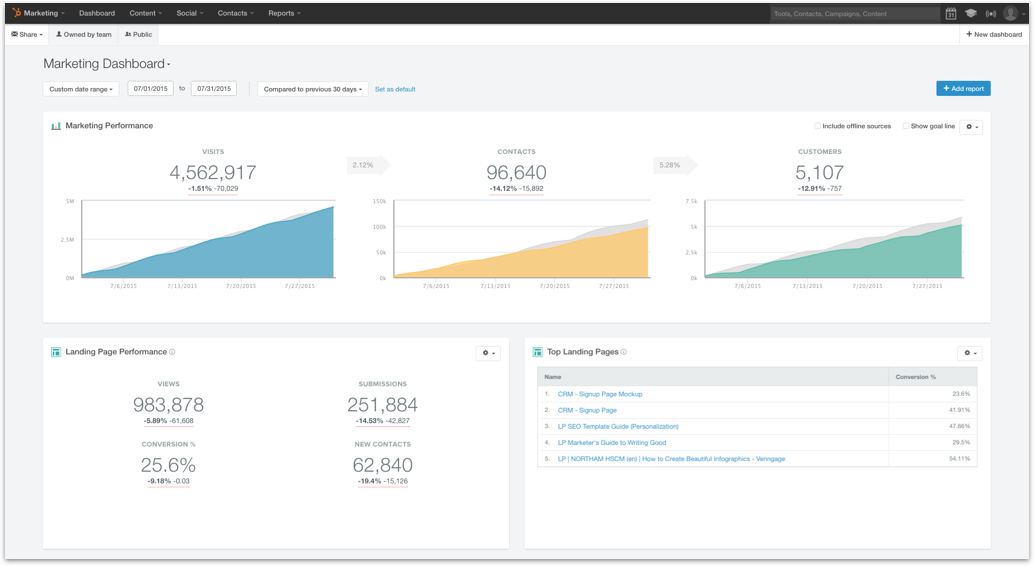
When it comes to your Dashboard, you need easy access to the data that's most relevant to your team, laid out in a way that aligns with your priorities. With that in mind, we're excited to launch brand new design for your HubSpot Dashboard that makes it easier than ever to customize your "morning cup of coffee" marketing metrics.

Today, when you log into HubSpot, you'll see a banner at the top of the screen enabling you to check out the newly designed Dashboard. When you click through, you'll be brought to the updated interface. There's a lot to love about the fresh new look. Here's a quick rundown of our favorite features.
- Keep track of all the same KPI's you're used to - The first thing to note is that the key Inbound Marketing metrics you’ve grown accustomed to aren’t going anywhere. Every data point in the previous rendition remains easily accessible in the refreshed update.
- Customize your modules - The new interface enables you to prioritize the marketing metrics that are most important to your team. Reorder the modules with a simple drag-and-drop, remove modules that aren’t vital to your current initiatives, and resize the most mission-critical metrics.
- Share your Dashboard with your team - With a few clicks, enable your Dashboard to be automatically dropped into your inbox at any frequency you desire. Or, if you just need a one-time snapshot, download the dashboard right to your desktop. Use the "Share" dropdown in the upper-left hand corner to email configure your email schedule.
- Easily access your other dashboards - If you use the Reporting Add-on, seamlessly scroll between your Dashboards without any extra clicks. Use the dropdown in the upper-left to navigate to another dashboard.
- Add custom reports to your Dashboard - Need something more tailored to your business? A deeper lifecycle stage breakdown? A revenue report? A funnel of your deal stages, or a sales forecast? The new dashboard allows you to add additional reports through its seamless integration with the Reporting Add-on. Already using the Add-on? To add a non-standard report, simply click Add Report in the upper-right. Find your report of choice from the Widget Library on the ensuing page, and click "Add." Don't see a Widget that fits your needs? Click Build From Scratch to create something tailored.
Not yet using the Reporting Add-on? Try it free for ten days. If you decide not to move forward, it'll go away --- no charges, no harm done.
Ready to see the new Dashboard? Check it out for yourself, and let us know what you think in the comments below!
- reCAPTCHA opt-out for Commerce Hub Checkout
- [Live] Try invoices without enrolling in Commerce Hub
- [Live] Collect payments locally through PADs (Canada) in Commerce Hub
- [Live] Collect payments through BACs (UK) on Commerce Hub
- March 2024 Release Notes
- [Live] Accept Partial Payments on Invoices
- [Live] Display Multiple Tax IDs on Invoices
- [Live] Commerce Hub Subscription Timeline Card
- [Live] Japanese Yen now available in Commerce Hub
- [Live] Commerce in the Global top-level navigation
You must be a registered user to add a comment. If you've already registered, sign in. Otherwise, register and sign in.